Understanding dSpikes
Dendrify introduces a new event-driven mechanism for modeling dendritic spiking, which is significantly simpler and more efficient than the traditional Hodgkin-Huxley formalism. This mechanism has three distinct phases.
INACTIVE PHASE: When the dendritic voltage is subthreshold OR the simulation step is within the refractory period. dSpikes cannot be generated during this phase.
RISE PHASE:
When the dendritic voltage crosses the dSpike threshold AND the refractory
period has elapsed. This triggers the instant activation of a positive current
that is deactivated after a specified amount of time (duration_rise). Also a
new refractory period begins.
FALL PHASE:
This phase starts automatically with a delay (offset_fall) after the dSpike
threshold is crossed. A negative current is activated instantly and then is
deactivated after a specified amount of time (duration_fall).
In this example we show:
How dendritic spiking is implemented in Dendrify.
import brian2 as b
from brian2.units import ms, mV, nS, pA, pF
from dendrify import Dendrite, NeuronModel, Soma
b.prefs.codegen.target = 'numpy' # faster for simple simulations
# Create neuron model
soma = Soma('soma', cm_abs=200*pF, gl_abs=10*nS)
dend = Dendrite('dend', cm_abs=50*pF, gl_abs=2.5*nS)
dend.dspikes('Na', g_rise=30*nS, g_fall=15*nS)
model = NeuronModel([(soma, dend, 15*nS)], v_rest=-60*mV)
model.config_dspikes('Na', threshold=-35*mV,
duration_rise=1.2*ms, duration_fall=2.4*ms,
offset_fall=0.5*ms, refractory=5*ms,
reversal_rise='E_Na', reversal_fall='E_K')
# Create neuron group
neuron = model.make_neurongroup(1, method='euler')
# Record variables of interest
vars = ['V_soma', 'V_dend', 'g_rise_Na_dend', 'g_fall_Na_dend',
'I_rise_Na_dend', 'I_fall_Na_dend']
M = b.StateMonitor(neuron, vars, record=True)
# Run simulation
b.run(10*ms)
neuron.I_ext_dend = 213*pA
b.run(150*ms)
neuron.I_ext_dend = 0*pA
b.run(80*ms)
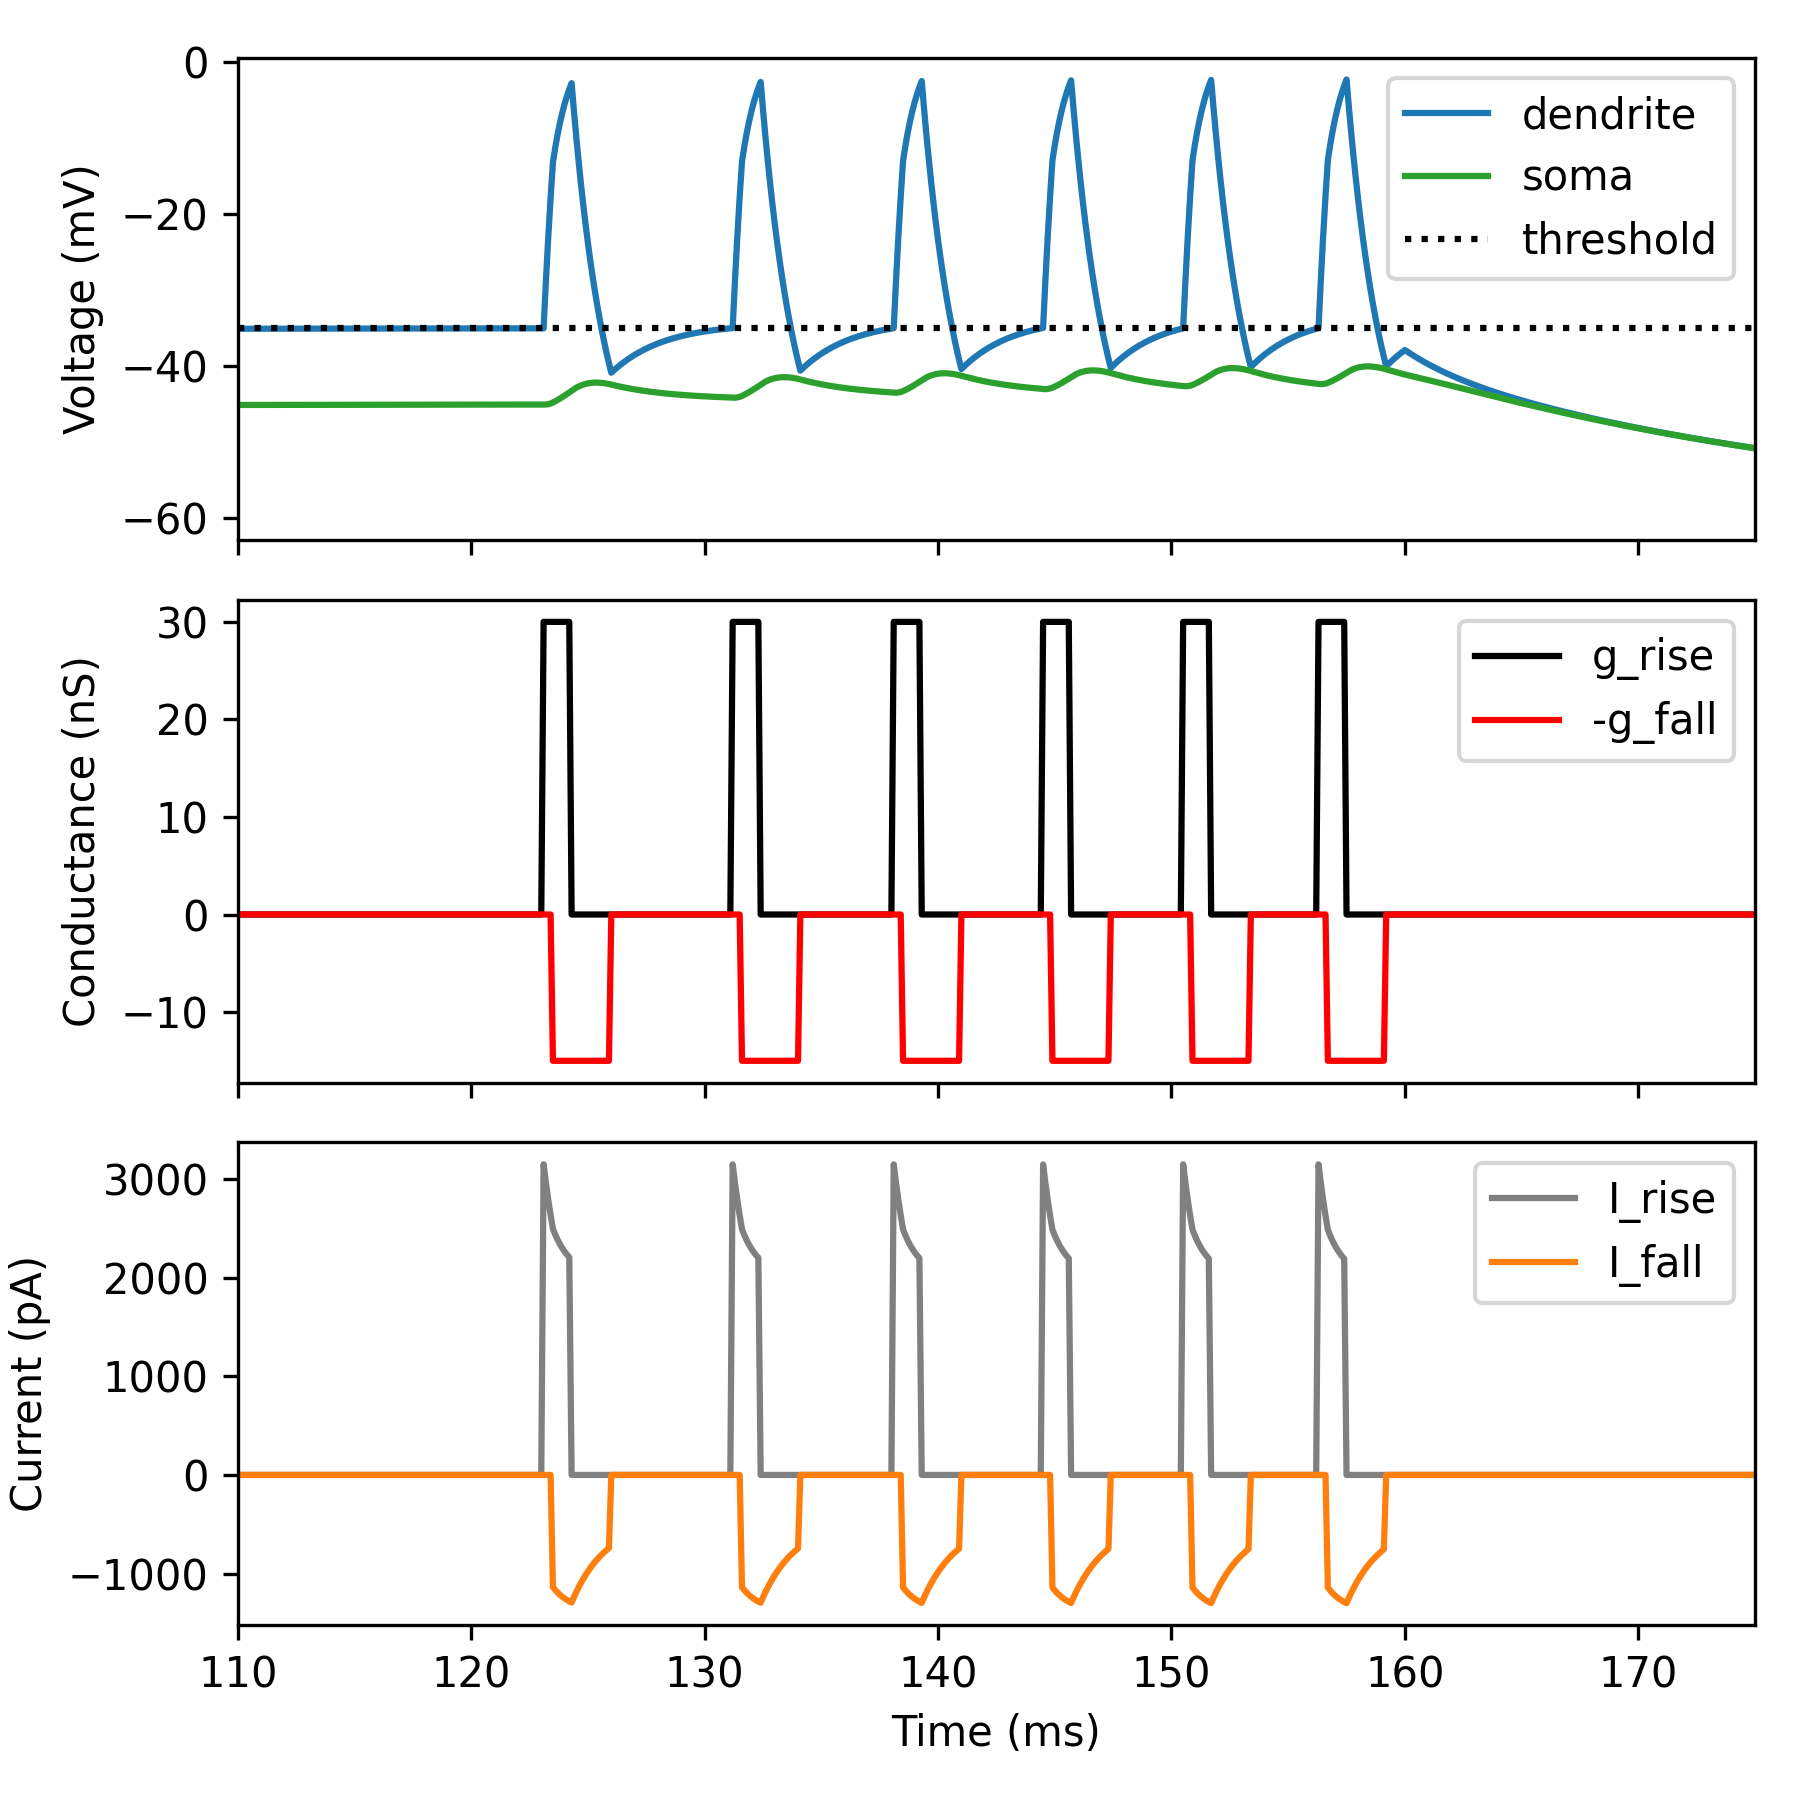
# Visualize results
time = M.t/ms
v1 = M.V_soma[0]/mV
v2 = M.V_dend[0]/mV
fig, axes = b.subplots(3, 1, figsize=(6, 6), sharex=True)
ax0, ax1, ax2 = axes
ax0.plot(time, v2, label='dendrite')
ax0.plot(time, v1, label='soma', c='C2')
ax0.axhline(-35, ls=':', c='black', label='threshold')
ax0.set_ylabel('Voltage (mV)')
ax0.set_xlim(110, 175)
ax1.plot(time, M.g_rise_Na_dend[0]/nS, label='g_rise', c='black')
ax1.plot(time, -M.g_fall_Na_dend[0]/nS, label='-g_fall', c='red')
ax1.set_ylabel('Conductance (nS)')
ax2.plot(time, M.I_rise_Na_dend[0]/pA, label='I_rise', c='gray')
ax2.plot(time, M.I_fall_Na_dend[0]/pA, label='I_fall', c='C1')
ax2.set_ylabel('Current (pA)')
ax2.set_xlabel('Time (ms)')
for ax in axes:
ax.legend()
fig.tight_layout()
b.show()