Dendritic I/O curve
Dendritic integration can be quantified by comparing the observed depolarization resulting from the quasi-simultaneous activation of the same synaptic inputs, and the arithmetic sum of individual EPSPs (expected membrane depolarization). The dendritic input-output (I/O) relationship is easily described by plotting observed vs. expected depolarizations for different numbers of co-activated synapses (also see Tran-van-Minh et al, 2015).
In this example, we show:
How to calculate the dendritic I/O curve in a simple compartmental model.
How active dendritic conductances affect the I/O curve.
How to perform the above experiment in a vectorized and efficient manner.
import brian2 as b
from brian2.units import ms, mV, nS, pF
from dendrify import Dendrite, NeuronModel, Soma
b.prefs.codegen.target = 'numpy' # faster for simple simulations
# Create neuron model
soma = Soma('soma', cm_abs=200*pF, gl_abs=10*nS)
dend = Dendrite('dend', cm_abs=50*pF, gl_abs=2.5*nS)
dend.dspikes('Na', g_rise=30*nS, g_fall=15*nS)
dend.synapse('AMPA', tag='x', g=3*nS, t_decay=2*ms)
dend.synapse('NMDA', tag='x', g=3*nS, t_decay=50*ms)
model = NeuronModel([(soma, dend, 15*nS)], v_rest=-65*mV)
model.config_dspikes('Na', threshold=-35*mV,
duration_rise=1.2*ms, duration_fall=2.4*ms,
offset_fall=0.2*ms, refractory=5*ms,
reversal_rise='E_Na', reversal_fall='E_K')
# Create neuron group
"""Instead of creating a single neuron, we create a group of neurons, each
receiving a different number of synapses. This allows us to calculate the
dendritic I/O curve efficiently in a single simulation."""
N_syn = 15 # number of synapses
neurons = model.make_neurongroup(N_syn, method='euler',
threshold='V_soma > -40*mV',
reset='V_soma = -55*mV',
refractory=4*ms)
# Create input source
start = 10*ms
isi = 0.1*ms # inter-spike interval of input synapses
spiketimes = [(start + (i*isi)) for i in range(N_syn)]
I = b.SpikeGeneratorGroup(N_syn, range(N_syn), spiketimes)
# Connect input to neurons
synaptic_effect = "s_AMPA_x_dend += 1.0; s_NMDA_x_dend += 1.0"
S = b.Synapses(I, neurons, on_pre=synaptic_effect)
# 1st neuron receives 1 synapse, 2nd neuron receives 2 synapses, etc.
S.connect('j >= i')
# Record dendritic voltage
M = b.StateMonitor(neurons, ['V_dend'], record=True)
# Run simulation
b.run(200 * ms)
# Visualize results
time = M.t/ms
v = M.V_dend/mV
v_rest = v[0][0]
u_epsp = max(v[0]) - v_rest
expected = [u_epsp * (i+1) for i in range(N_syn)]
actual = [max(v[i]) - v_rest for i in range(N_syn)]
linear = b.linspace(0, max(actual))
fig, axes = b.subplots(1, 2, figsize=(6, 4))
ax0, ax1 = axes
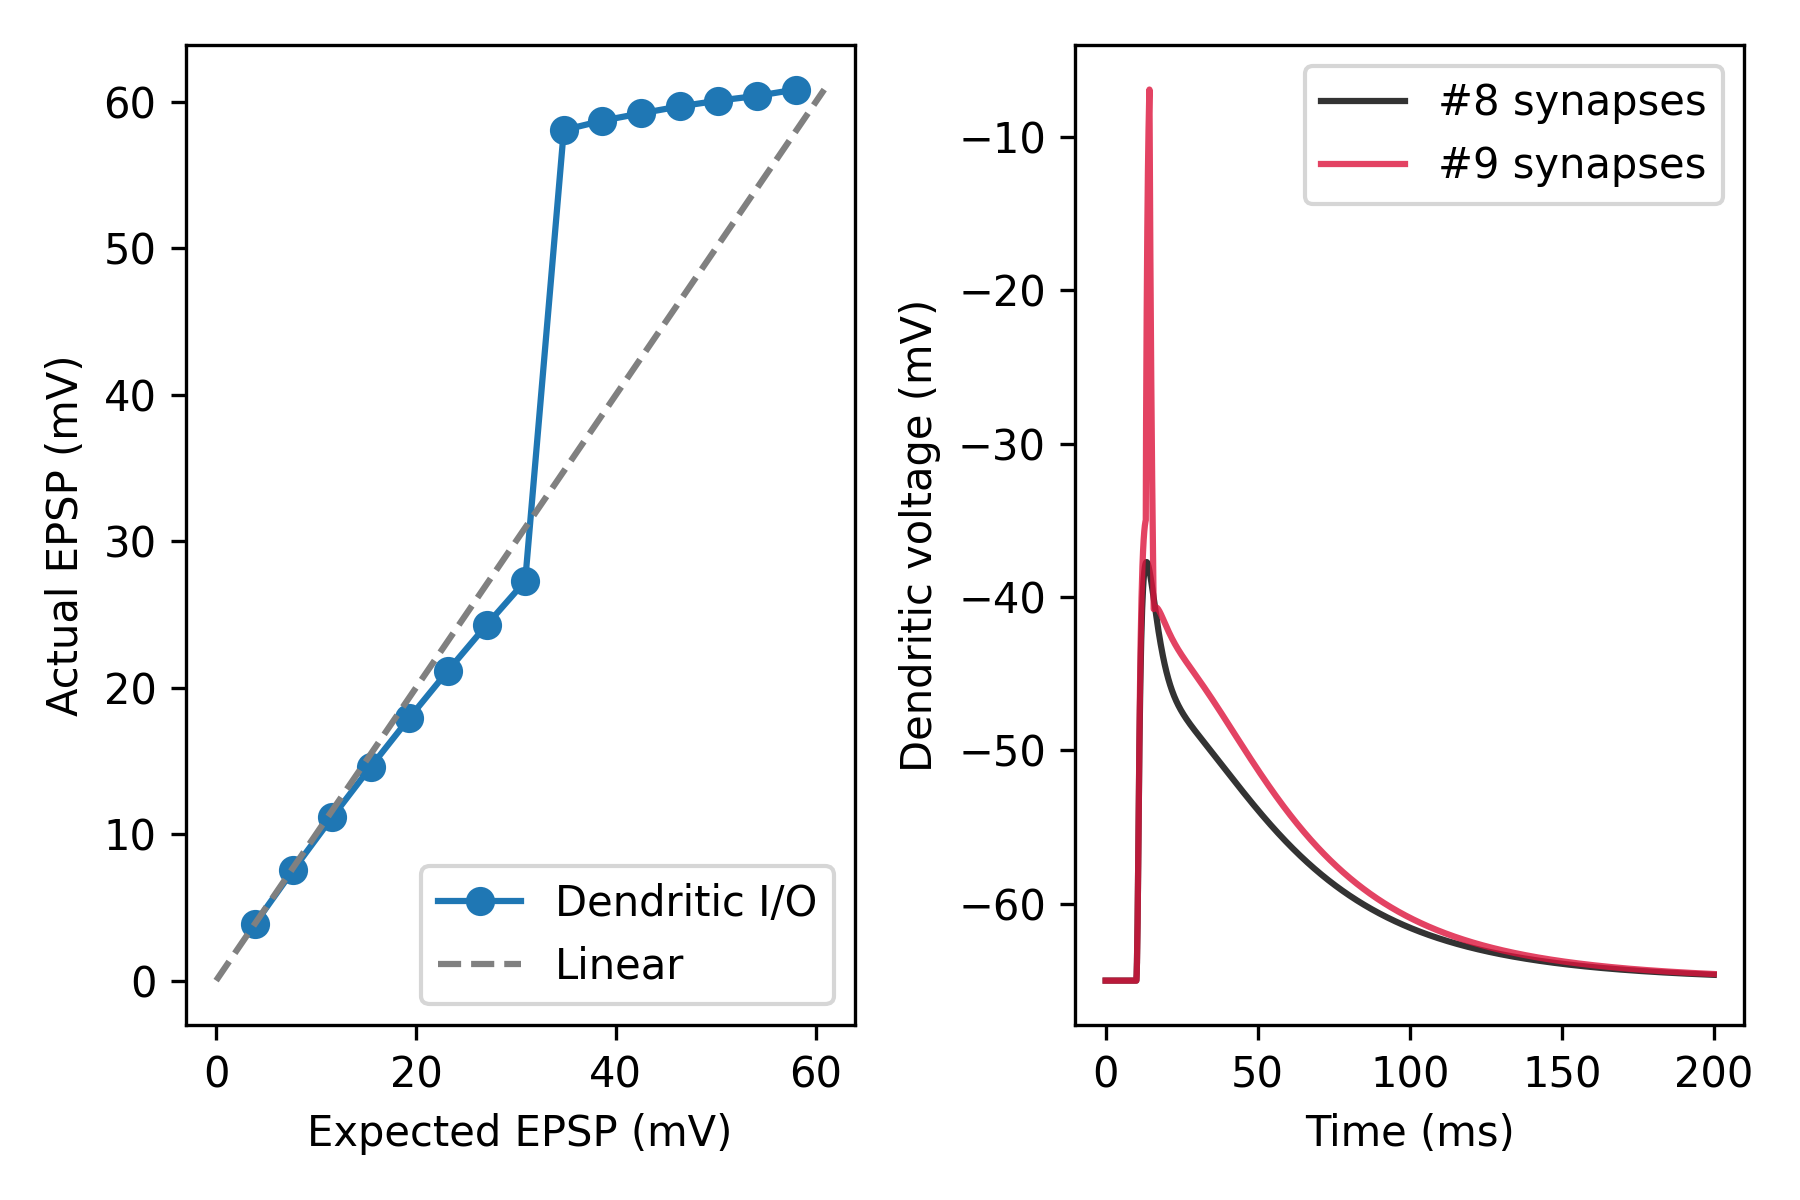
ax0.plot(expected, actual, 'o-', label='Dendritic I/O')
ax0.plot(linear, linear, '--', color='gray', label='Linear')
ax0.set_xlabel('Expected EPSP (mV)')
ax0.set_ylabel('Actual EPSP (mV)')
ax0.legend()
ax1.plot(time, v[7], label='#8 synapses', c='black', alpha=0.8)
ax1.plot(time, v[8], label='#9 synapses', c='crimson', alpha=0.8)
ax1.set_xlabel('Time (ms)')
ax1.set_ylabel('Dendritic voltage (mV)')
ax1.legend()
fig.tight_layout()
b.show()