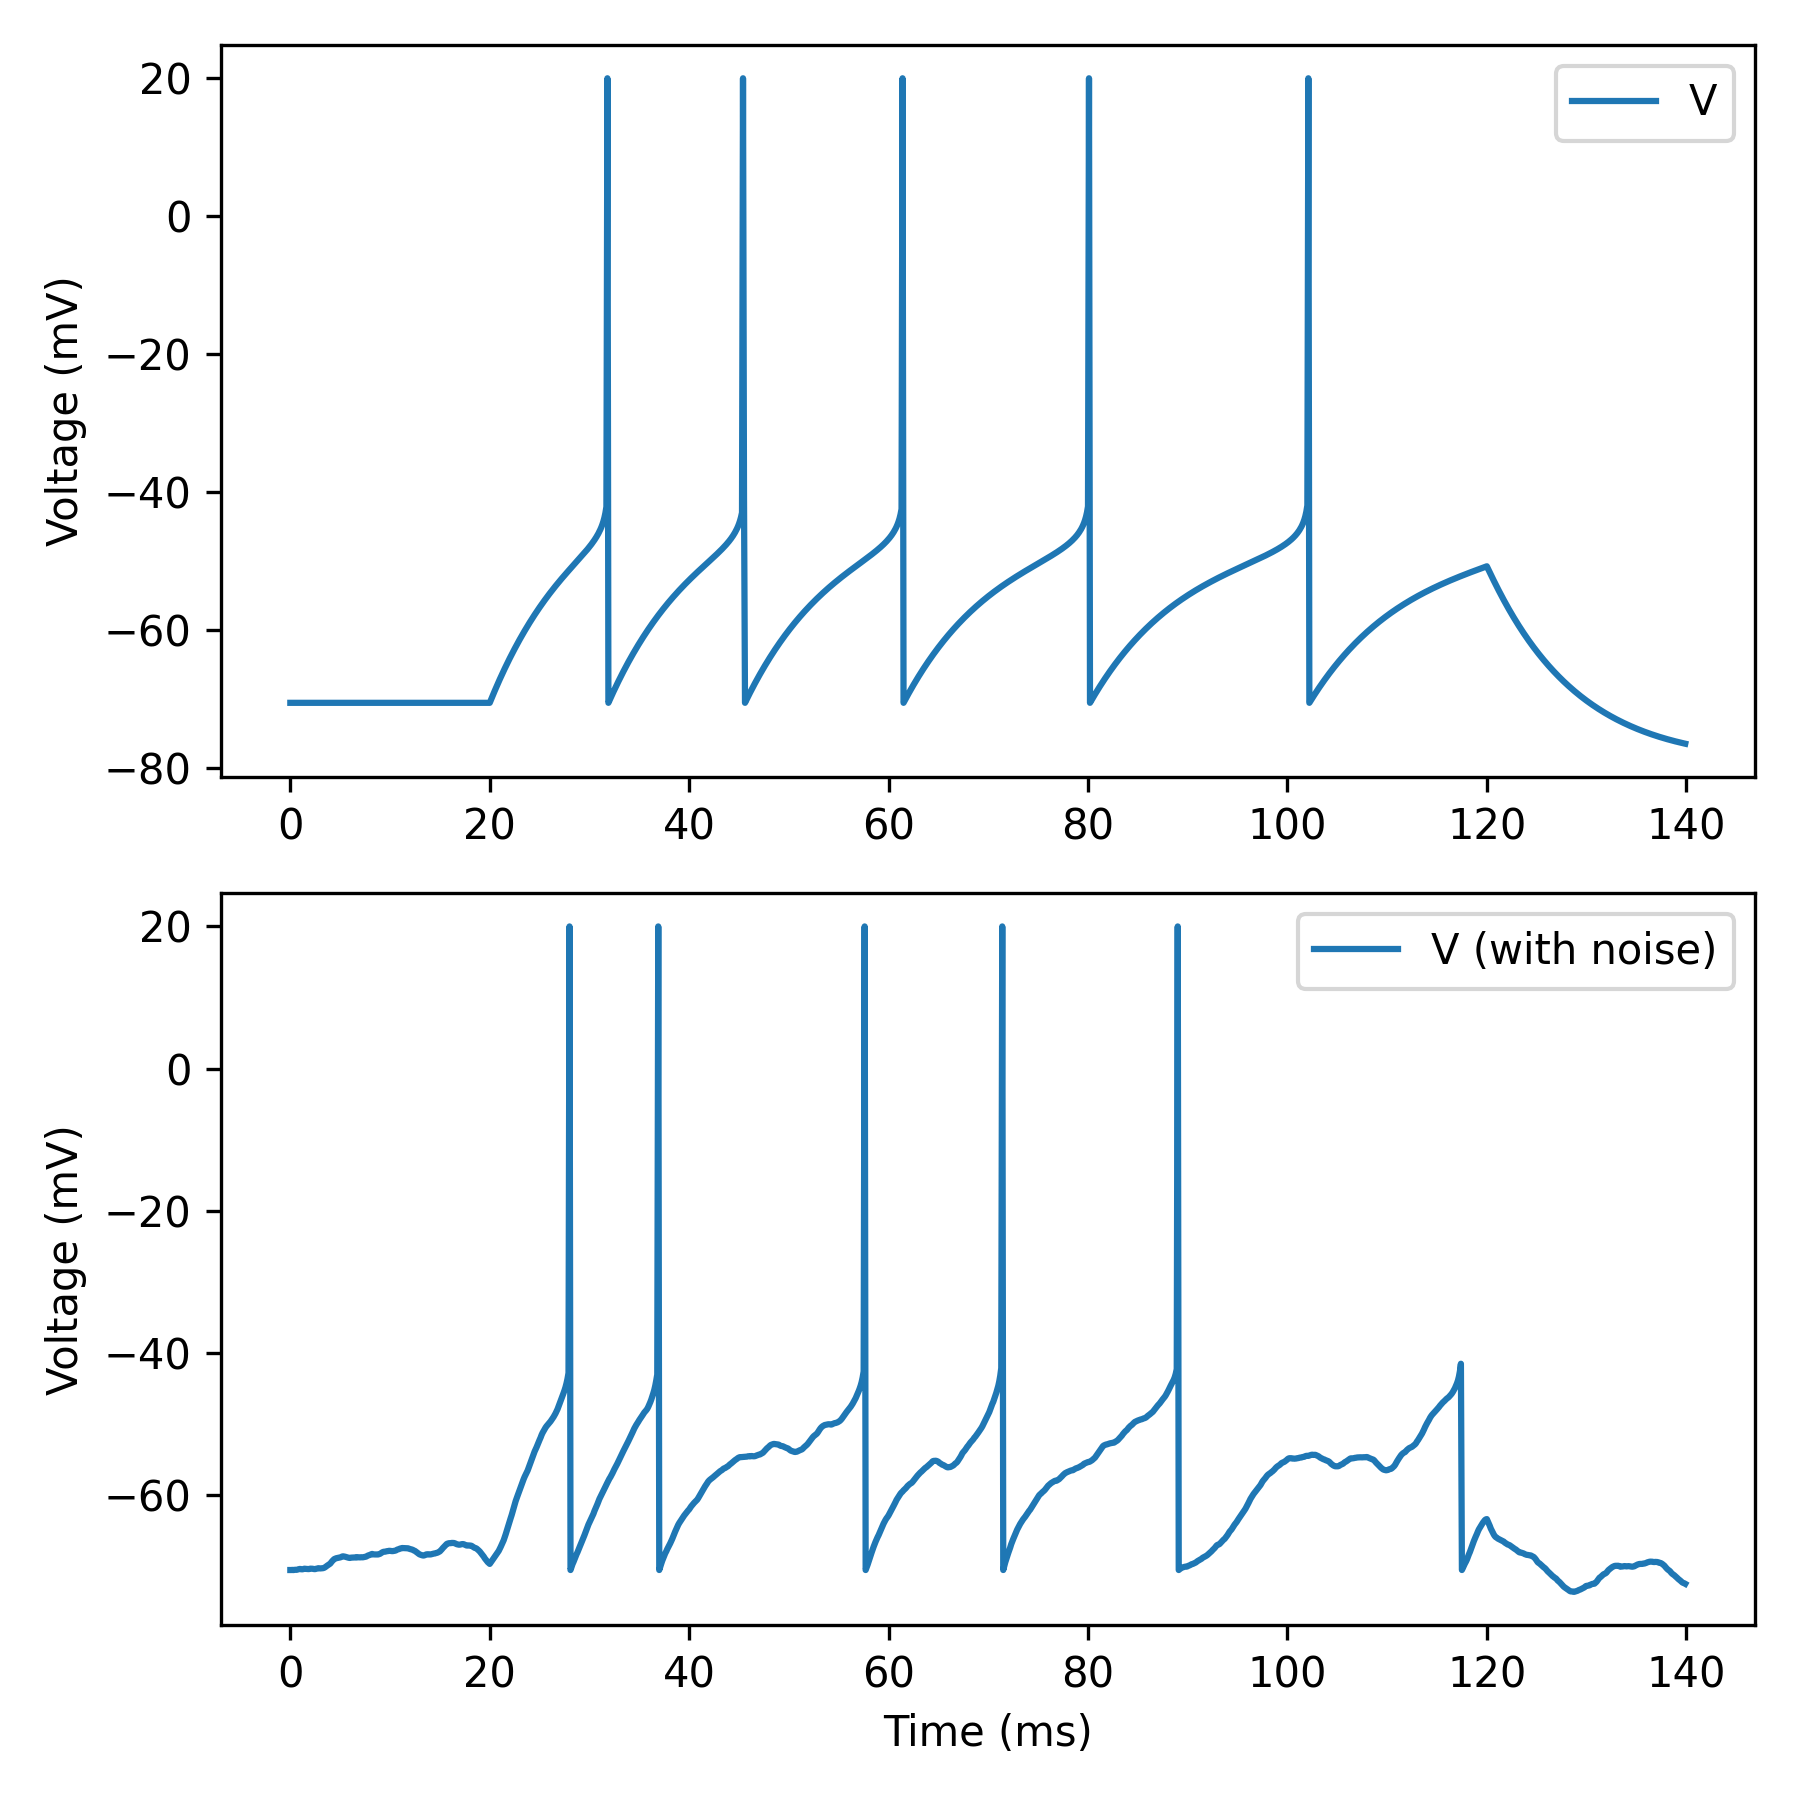
AdEx neuron + noise
The Dendrify implementation of the Adaptive exponential integrate-and-fire model (adapted from Brian’s examples).
In this example, we also explore:
How to add gaussian noise.
How to create NeuronGroups with different properties using a single PointNeuronModel.
Resources:
import brian2 as b
from brian2.units import ms, mV, nA, nS, pA, pF

from dendrify import PointNeuronModel

b.prefs.codegen.target = 'numpy'  # faster for simple simulations
b.seed(1234)  # for reproducibility

# Create neuron model
model = PointNeuronModel(model='adex',
                         cm_abs=281*pF,
                         gl_abs=30*nS,
                         v_rest=-70.6*mV)

model.add_params({'Vth': -50.4*mV,
                  'DeltaT': 2*mV,
                  'tauw': 144*ms,
                  'a': 4*nS,
                  'b': 0.0805*nA,
                  'Vr': -70.6*mV})

# Create a NeuronGroup
neuron = model.make_neurongroup(N=1, threshold='V>Vth+5*DeltaT',
                                reset='V=Vr; w+=b',
                                method='euler')

# Update model with noise and create a new NeuronGroup
model.noise(mean=50*pA, sigma=300*pA, tau=2*ms)
noisy_neuron = model.make_neurongroup(N=1, threshold='V>Vth+5*DeltaT',
                                      reset='V=Vr; w+=b',
                                      method='euler')

# Record voltages and spike times
trace = b.StateMonitor(neuron, 'V', record=True)
spikes = b.SpikeMonitor(neuron)
noisy_trace = b.StateMonitor(noisy_neuron, 'V', record=True)
noisy_spikes = b.SpikeMonitor(noisy_neuron)

# Run simulation
b.run(20 * ms)
neuron.I_ext = 1*nA
noisy_neuron.I_ext = 1*nA
b.run(100 * ms)
neuron.I_ext = 0*nA
noisy_neuron.I_ext = 0*nA
b.run(20 * ms)

# Trick to draw nicer spikes in I&F models
vm = trace[0].V[:]
noisy_vm = noisy_trace[0].V[:]
for t1, t2 in zip(spikes.t, noisy_spikes.t):
    i = int(t1 / b.defaultclock.dt)
    j = int(t2 / b.defaultclock.dt)
    vm[i] = 20*mV
    noisy_vm[j] = 20*mV

# Plot results
fig, axes = b.subplots(2, 1, figsize=[6, 6])
ax1, ax2 = axes
ax1.plot(trace.t / ms, vm / mV, label='V')
ax1.set_ylabel('Voltage (mV)')
ax1.legend()

ax2.plot(noisy_trace.t / ms, noisy_vm / mV, label='V (with noise)')
ax2.set_ylabel('Voltage (mV)')
ax2.set_xlabel('Time (ms)')
ax2.legend()
fig.tight_layout()
b.show()