Input resistance
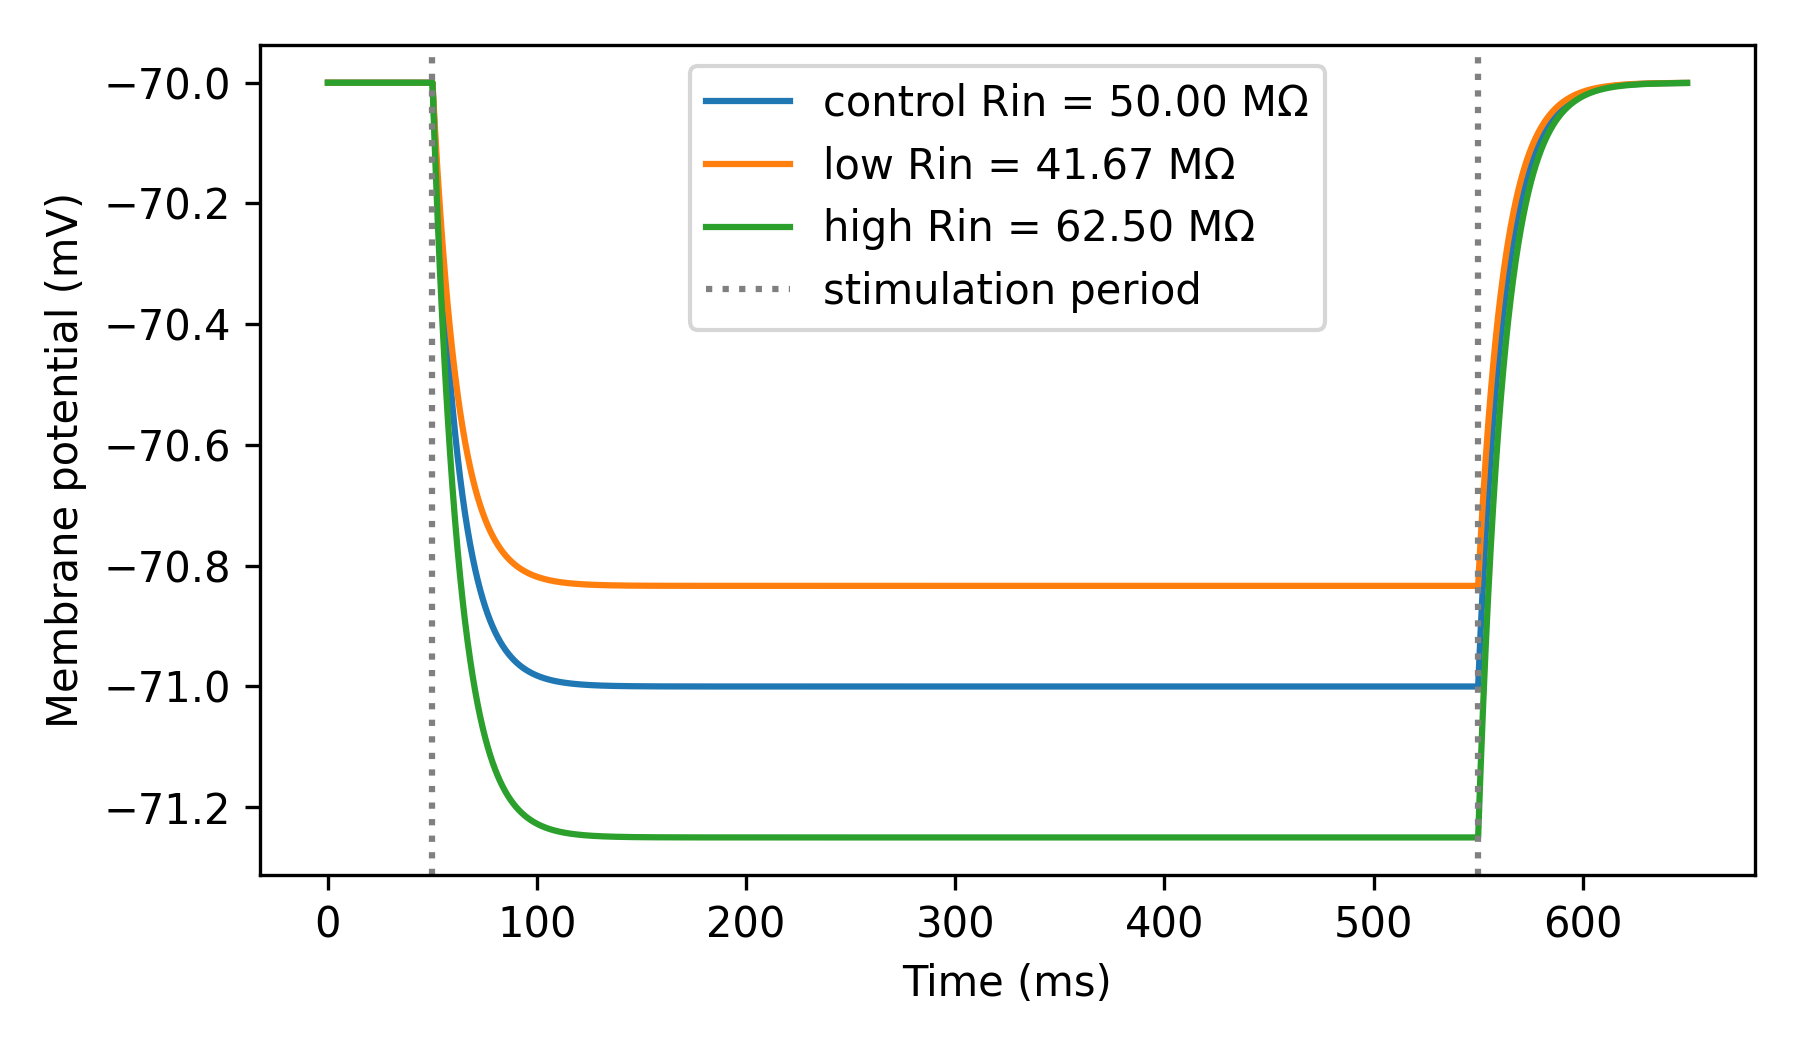
Input resistance (Rin) determines how much a neuron depolarizes in response
to a steady current. It is a useful metric of a neuron’s excitability; neurons
with high Rin depolarize more in response to a given current than neurons
with low Rin. Rin is often measured experimentally by injecting a small
current I into the neuron and measuring the steady-state change in its
membrane potential ΔV. Using Ohm’s law, Rin can be estimated as
Rin = ΔV/I.
In this example we show:
How to calculate
Rinin a point neuron model.How
Rinis affected by changes in the neuron’s membrane leak conductancegl.
Note: We also scale the neuron’s membrane capacitance cm to maintain a
constant membrane time constant (τm = cm/gl).
import brian2 as b
from brian2.units import Mohm, ms, mV, nS, pA, pF

from dendrify import PointNeuronModel

b.prefs.codegen.target = 'numpy'  # faster for simple simulations

# Parameters
g_leakage = 20*nS  # membrane leak conductance
capacitance = 250*pF  # membrane capacitance
EL = -70*mV  # resting potential

# Create neuron models
control = PointNeuronModel(model='leakyIF', cm_abs=capacitance,
                           gl_abs=g_leakage, v_rest=EL)

low_rin = PointNeuronModel(model='leakyIF', cm_abs=capacitance*1.2,
                           gl_abs=g_leakage*1.2, v_rest=EL)

high_rin = PointNeuronModel(model='leakyIF', cm_abs=capacitance*0.8,
                            gl_abs=g_leakage*0.8, v_rest=EL)

# Create NeuronGroups (no threshold or reset conditions for simplicity)
control_neuron = control.make_neurongroup(N=1, method='euler')
low_rin_neuron = low_rin.make_neurongroup(N=1, method='euler')
high_rin_neuron = high_rin.make_neurongroup(N=1, method='euler')

# Record voltages
control_monitor = b.StateMonitor(control_neuron, 'V', record=0)
low_rin_monitor = b.StateMonitor(low_rin_neuron, 'V', record=0)
high_rin_monitor = b.StateMonitor(high_rin_neuron, 'V', record=0)

# Run simulation
I = -20*pA  # current pulse amplitude
b.run(50*ms)
for n in [control_neuron, low_rin_neuron, high_rin_neuron]:
    n.I_ext = -20*pA
b.run(500*ms)
for n in [control_neuron, low_rin_neuron, high_rin_neuron]:
    n.I_ext = 0*pA
b.run(100*ms)

# Calculate Rin
Rin_control = (min(control_monitor.V[0]) - control_monitor.V[0][500]) / I
Rin_low = (min(low_rin_monitor.V[0]) - low_rin_monitor.V[0][500]) / I
Rin_high = (min(high_rin_monitor.V[0]) - high_rin_monitor.V[0][500]) / I

# Plot results
b.figure(figsize=(6, 3.5))
b.plot(control_monitor.t/ms, control_monitor.V[0]/mV,
       label='control Rin = {:.2f} MΩ'.format(Rin_control / Mohm))
b.plot(low_rin_monitor.t/ms, low_rin_monitor.V[0]/mV,
       label='low Rin = {:.2f} MΩ'.format(Rin_low / Mohm))
b.plot(high_rin_monitor.t/ms, high_rin_monitor.V[0]/mV,
       label='high Rin = {:.2f} MΩ'.format(Rin_high / Mohm))
b.axvline(50, ls=':', c='gray', label='stimulation period')
b.axvline(550, ls=':', c='gray')
b.xlabel('Time (ms)')
b.ylabel('Membrane potential (mV)')
b.legend()
b.tight_layout()
b.show()