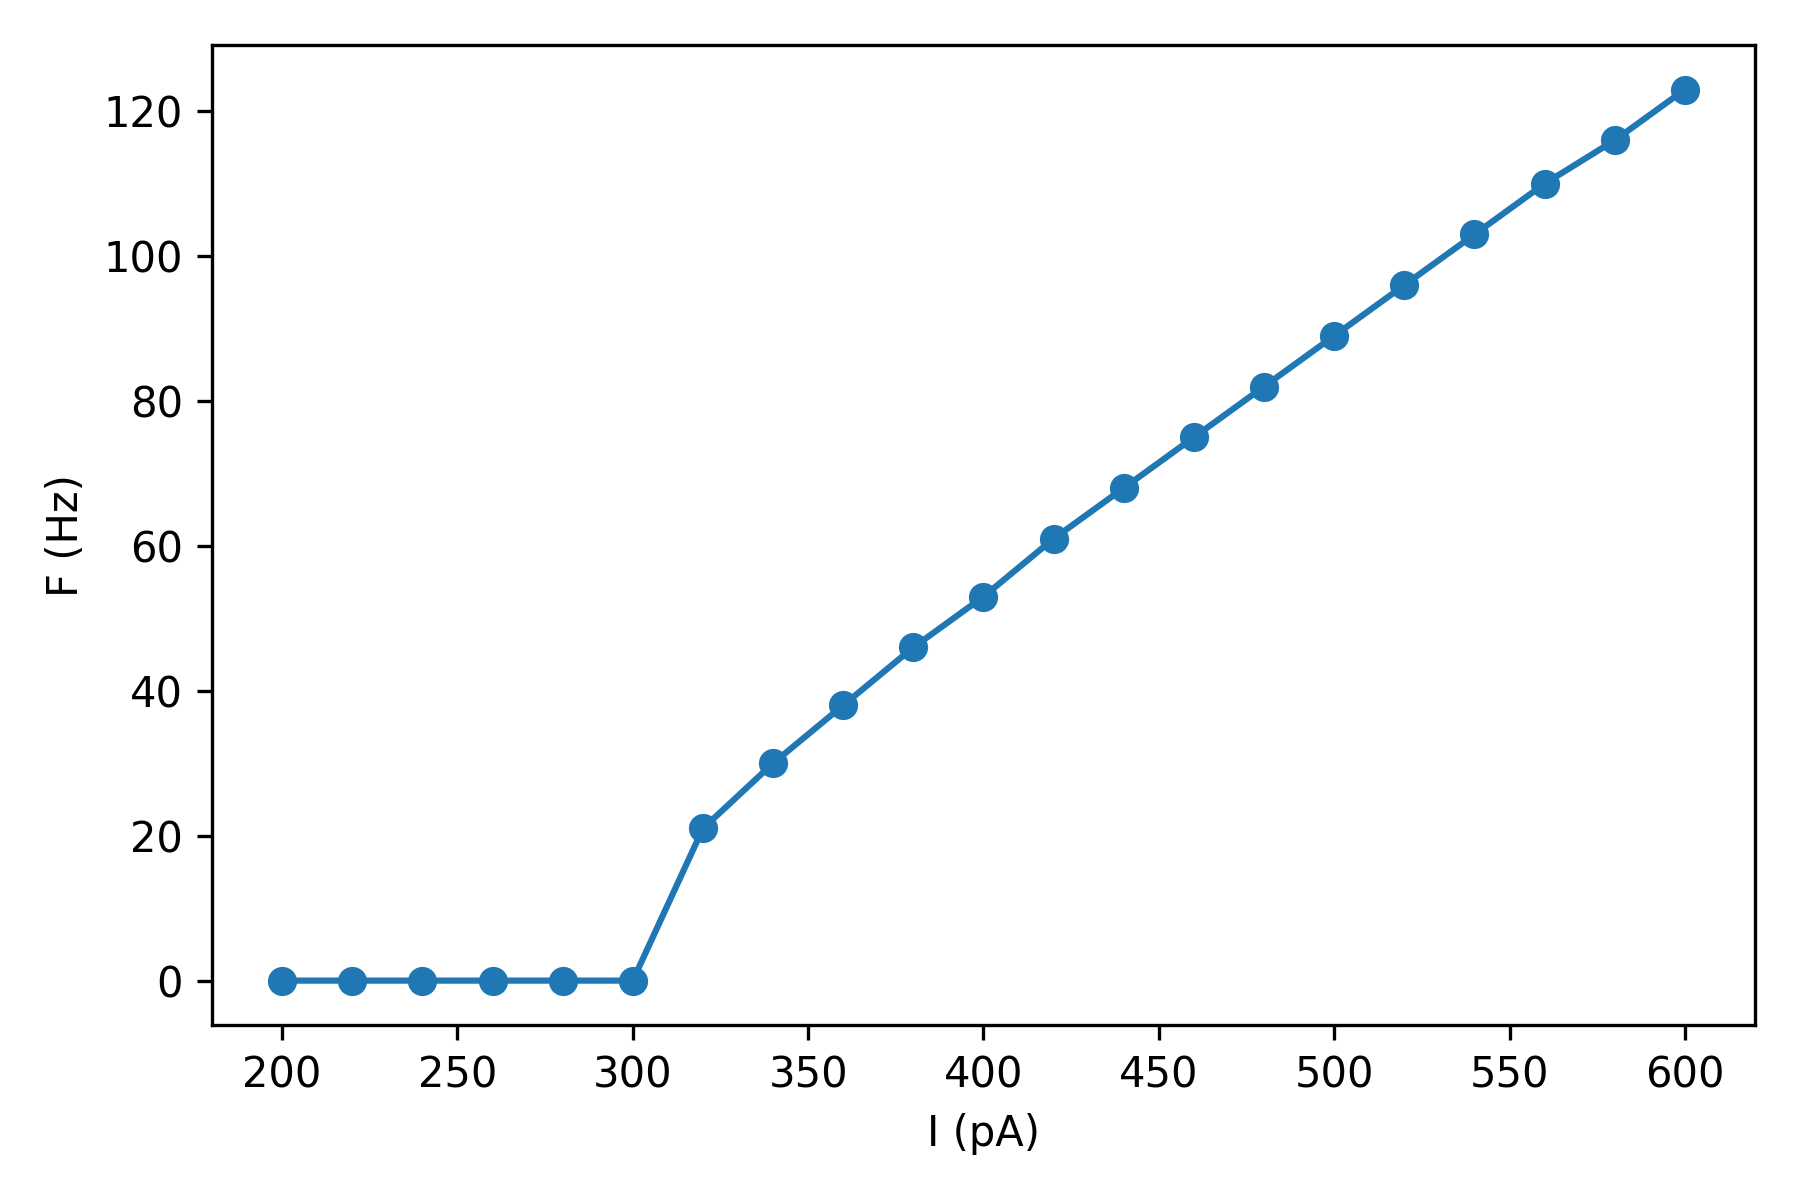
Frequency-current curve
A frequency-current curve (F-I curve) is the function that relates the net
current I flowing into a neuron to its firing rate F.
In this example we show:
How to calculate the somatic F-I curve for a simple 2-compartment neuron model.
How to perform the above experiment in a vectorized and efficient manner.
import brian2 as b
from brian2.units import ms, mV, nS, pA, pF

from dendrify import Dendrite, NeuronModel, Soma

b.prefs.codegen.target = 'numpy'  # faster for simple simulations

# Create neuron model
soma = Soma('soma', cm_abs=200*pF, gl_abs=10*nS)
dend = Dendrite('dend', cm_abs=50*pF, gl_abs=2.5*nS)
model = NeuronModel([(soma, dend, 15*nS)], v_rest=-65*mV)

# Range of current amplitudes to test
I = range(200, 620, 20) * pA

# Create neuron group
"""Instead of creating a single neuron, we create a group of neurons, each with
a different value of ``I_ext``. This allows us to calculate the F-I curve in a
single simulation."""
neurons = model.make_neurongroup(len(I), method='euler',
                                 threshold='V_soma > -40*mV',
                                 reset='V_soma = -55*mV',
                                 refractory=4*ms)

# Record spike times
spikes = b.SpikeMonitor(neurons)

# Run simulation
sim_time = 1000*ms
neurons.I_ext_soma = I
b.run(sim_time)

# Visualize F-I curve
F = [len(s) / sim_time for s in spikes.spike_trains().values()]
b.figure(figsize=(6, 4))
b.plot(I/pA, F, 'o-')
b.xlabel('I (pA)')
b.ylabel('F (Hz)')
b.tight_layout()
b.show()